Lab 3: Map Projection
Due Date: Lab_3 Due: Feb 15
Instructor: Xiaozhong Sun (xs243@cornell.edu)
Lab TAs: Ishan Keskar [iuk3@cornell.edu]
Location: Sibley 305, Barclay Gibbs Jones Computer Lab
Total Points: 120
Goals for this lab
In today’s lab, you will have a thorough understanding of map projection and projecting through a series of practice. You will learn and understand
- How to check projection information of your map layer, differentiate between Projected Coordinate System (PCS) and Geographic Coordinate System (GCS);
- What is “projection on the fly”;
- Define a projection for a map layer if it does not have a projection;
- Or you suspect it has the wrong one (Define Projection);
- And create and export a new map layer with re-defined projection (Project).
Today’s lab session can be a bit “cumbersome and confusing”, because we need to produce many “malfunctions” and assume many scenarios.
In order to successfully fix and understand these hypothetical issues, you need to, first, strictly follow the lab’s operation sequence to add map layers, otherwise you may not be able to reproduce these “failures”. Second, you have to start a new map session for different practice every time.
If you encounter problems during the process, feel free to ask!
Know your data
There are a lot of data used in today’s lab, they are saved under the folder of lab_session. There is another folder of homework, you will find the data you need for your homework.
Setting work environment
From this lab, we start to apply spatial analysis tools and make change to our spatial data. Therefore, it is important to differentiate between the raw data (input data) and modified data (output data).
Before we begin, we firstly change the environmental settings that allow you to set up the default input/output workspace. By doing so, Arcgis Pro will automatically direct to your lab folder and save all the output data into your created Output folder.
Remember, this step is very crucial. This should become one of your routines for doing any spatial analysis in the future!
Within the home folder stored everything about lab_3, create an “Raw Data” folder that stores all the Lab 3 data downloaded from Canvas, and an “Output” folder separately which you will save the outputs from running tools.
After create a new lab_3 project file within your home folder. You can specify Geoprocessing environment settings for your project using the
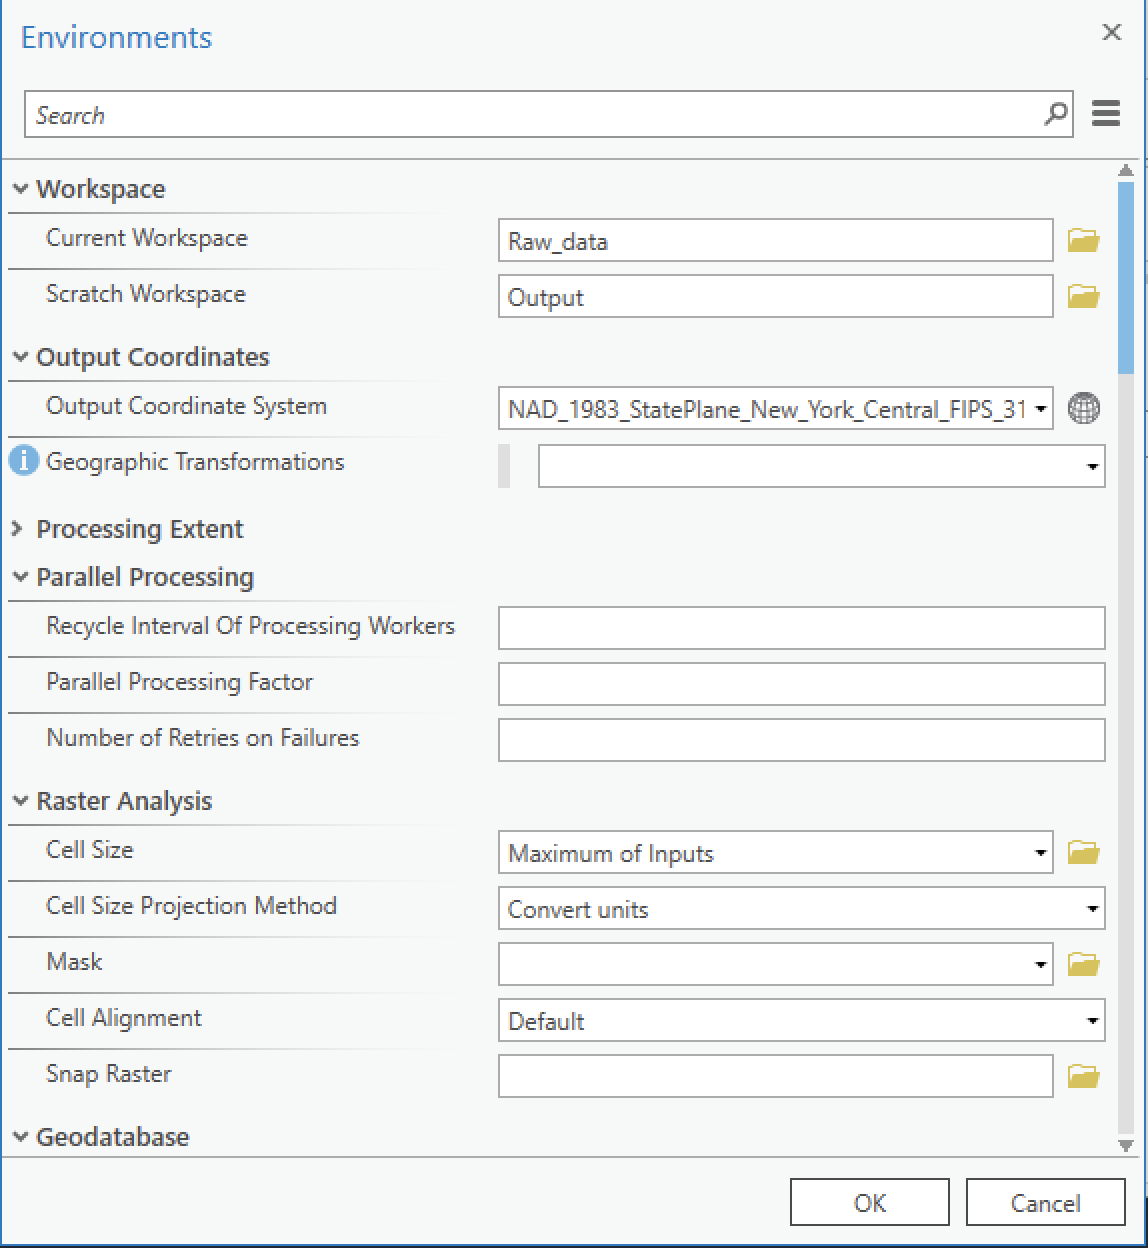
Environmentswindow. These settings are saved with your project and will be automatically used by all tools that honor the environments. Open this window by clickingEnvironmentson theAnalysisribbon tab
Under the
Workspacetab, set theCurrent workspaceas the “Raw Data” folder andScratch Workspaceas the ‘Output’ folder you created. Leave the Output Coordinate System as blank for this particular lab, and others as default. Hit OK. Next time, when you select input features, ArcGIS will automatically navigate you to the current workspace by default, while the output layers you created will be stored into the scratch workspace.
Projection “on the fly”
The following is a great blog taking about projection on the fly and geographic transformations:
Imagine for a moment that computers do not exist. You have a couple of paper maps that you need to overlay to determine where to build a new road. You get the maps, you lay them on top of one another on a light table, and … they don’t match. They were drawn in different coordinate systems. You’ll need to redraw one of them before they can be used together. Do you know how to redraw a map by hand from one coordinate system to another? I certainly don’t, but I bet it’s a lot of work. Projection on the fly performs the same process as the Project tool, only the data does not change. It is merely displayed in the new coordinate system temporarily. Projection on the fly is what ArcGIS does to resolve conflicts when your data is in a different coordinate system than your map. It does this so the data can draw in the correct place on the map. (From Heather Smith)
Now let’s create a new empty Map in ArcGIS Pro and name it “Projection on the fly”.
In the map viewing area, with base map turned on, notice at the bottom: you can see the coordinates of the location displayed as Latitude and Longitude Units for default
These are the default coordinate system based on the existing map layers (World Topographic map and World Hillshade) that are pre-loaded to our Map view.
If you right click on the World Topographic Map layer and go to
Layer Properties, then select Source —>
Spatial Reference, you can learn about its PCS (WGS 1984
Web Mercator Auxiliary Sphere) and GCS (WGS 1984).
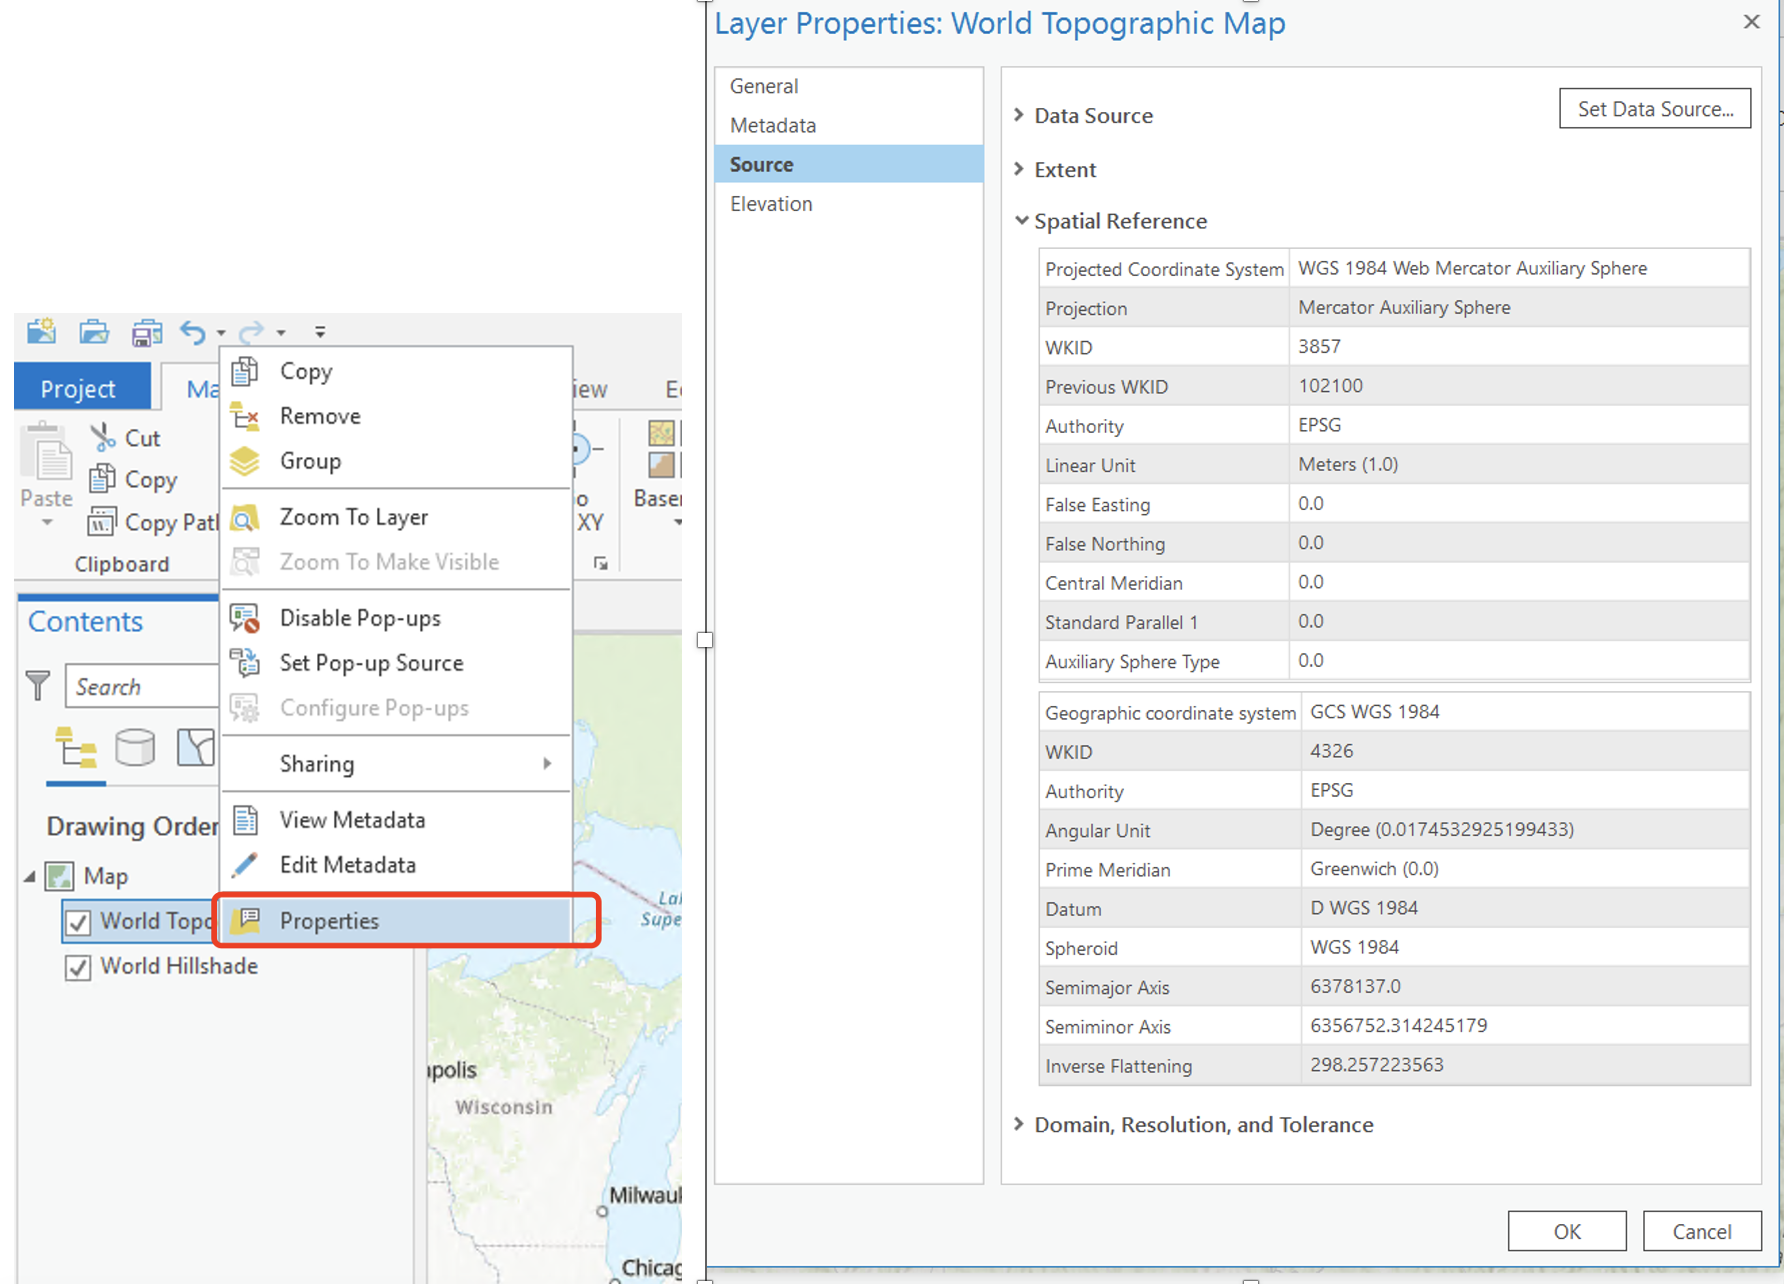
Google it if you want to learn more. Here is a great blog about PCS and GCS.
Notice that under this PCS, the linear unit is
actually Meters, this will allow our measurement
through map to be in Meters (You can try this by using the
Measure tool under the Map tab’s
Inquiry group. This is why we want a PCS defined, because
it allow us to transform hard-to-perceived decimal degree into familiar
2-D flat world). Now, after your check, you can change the display of
coordinates into Meters by pressing the down arrow.
Next, if you right click on Map Frame instead of layers,
and go to Properties, under
Coordinate Systems: you will notice below the
“Current XY” and “Current Z” headings
show the current horizontal and vertical coordinate systems of the
Map Frame (In this case, there is no vertical
coordinate system defined).
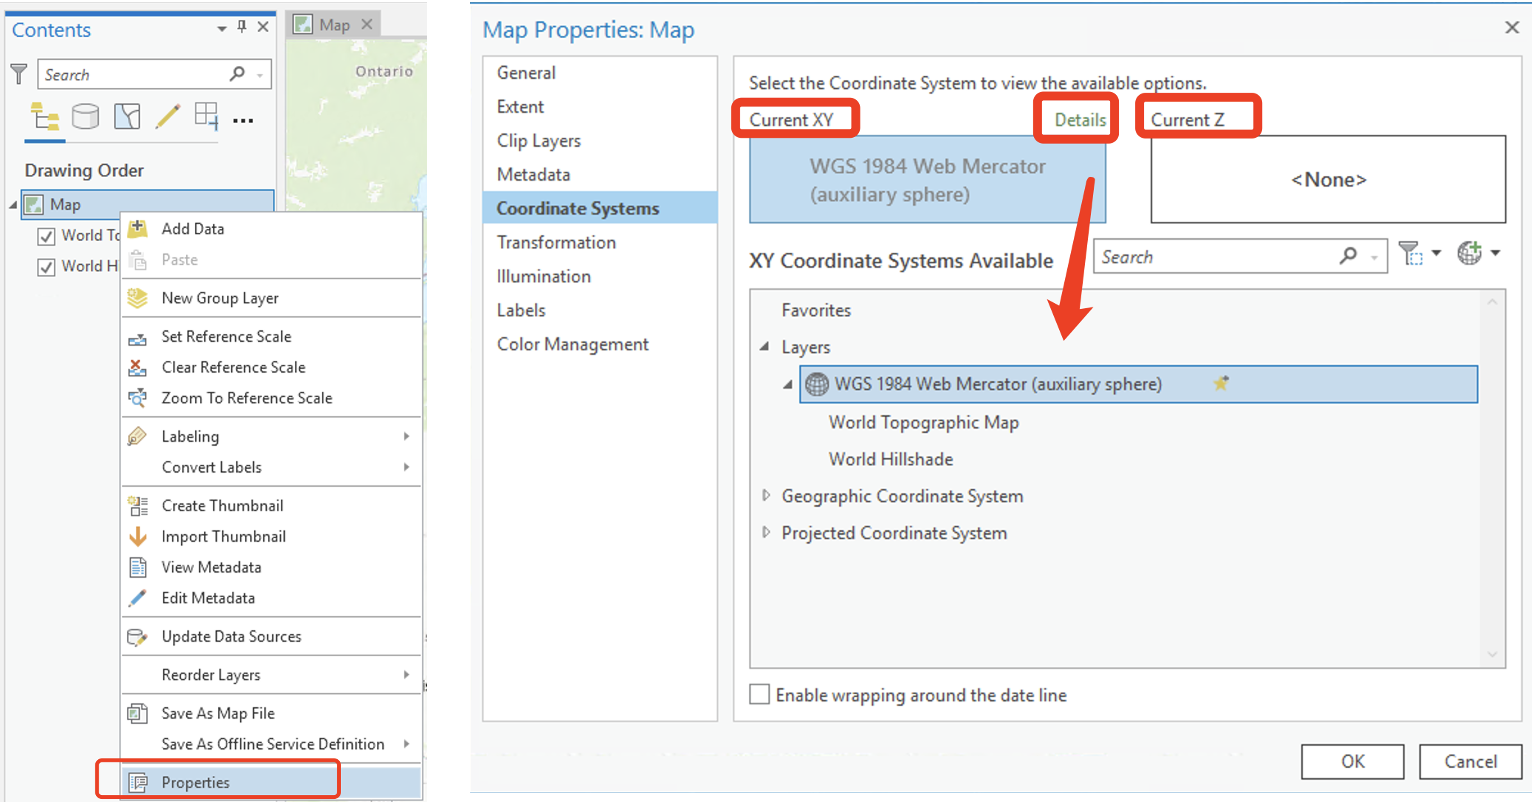
Click Details for “Current XY” to see
how they are defined. We can see it is defined as WGS 1984 Web Mercator
(auxiliary sphere). This means without change this projection under your
current Map Frame, any additional layer we add to
this Map frame will be automatically “projected on
the fly” based on this coordinate system regardless of their own
projection.
Now, you may grasp what is the determined factor of projection on the fly: the coordinate system for your current Map Frame!!!
Before you import all your map layers, if you are required not to use the default coordinate system of your current map frame, you will need to change it.
To change either the horizontal or vertical coordinate system, click the button below the Current XY or Current Z heading, respectively. Choose an appropriate coordinate system from the corresponding Coordinate Systems Available list. You can search keywords in the Search box to locate a specific coordinate system.
For this practice, go to Projected coordinate system
—> Continental —> North America —>
NAD 1983 (2011) Contiguous USA Albers, and click OK. Or
simply copy and paste NAD 1983 (2011) Contiguous USA Albers
into the search box on the top. Note how the orientation of your map
changes.
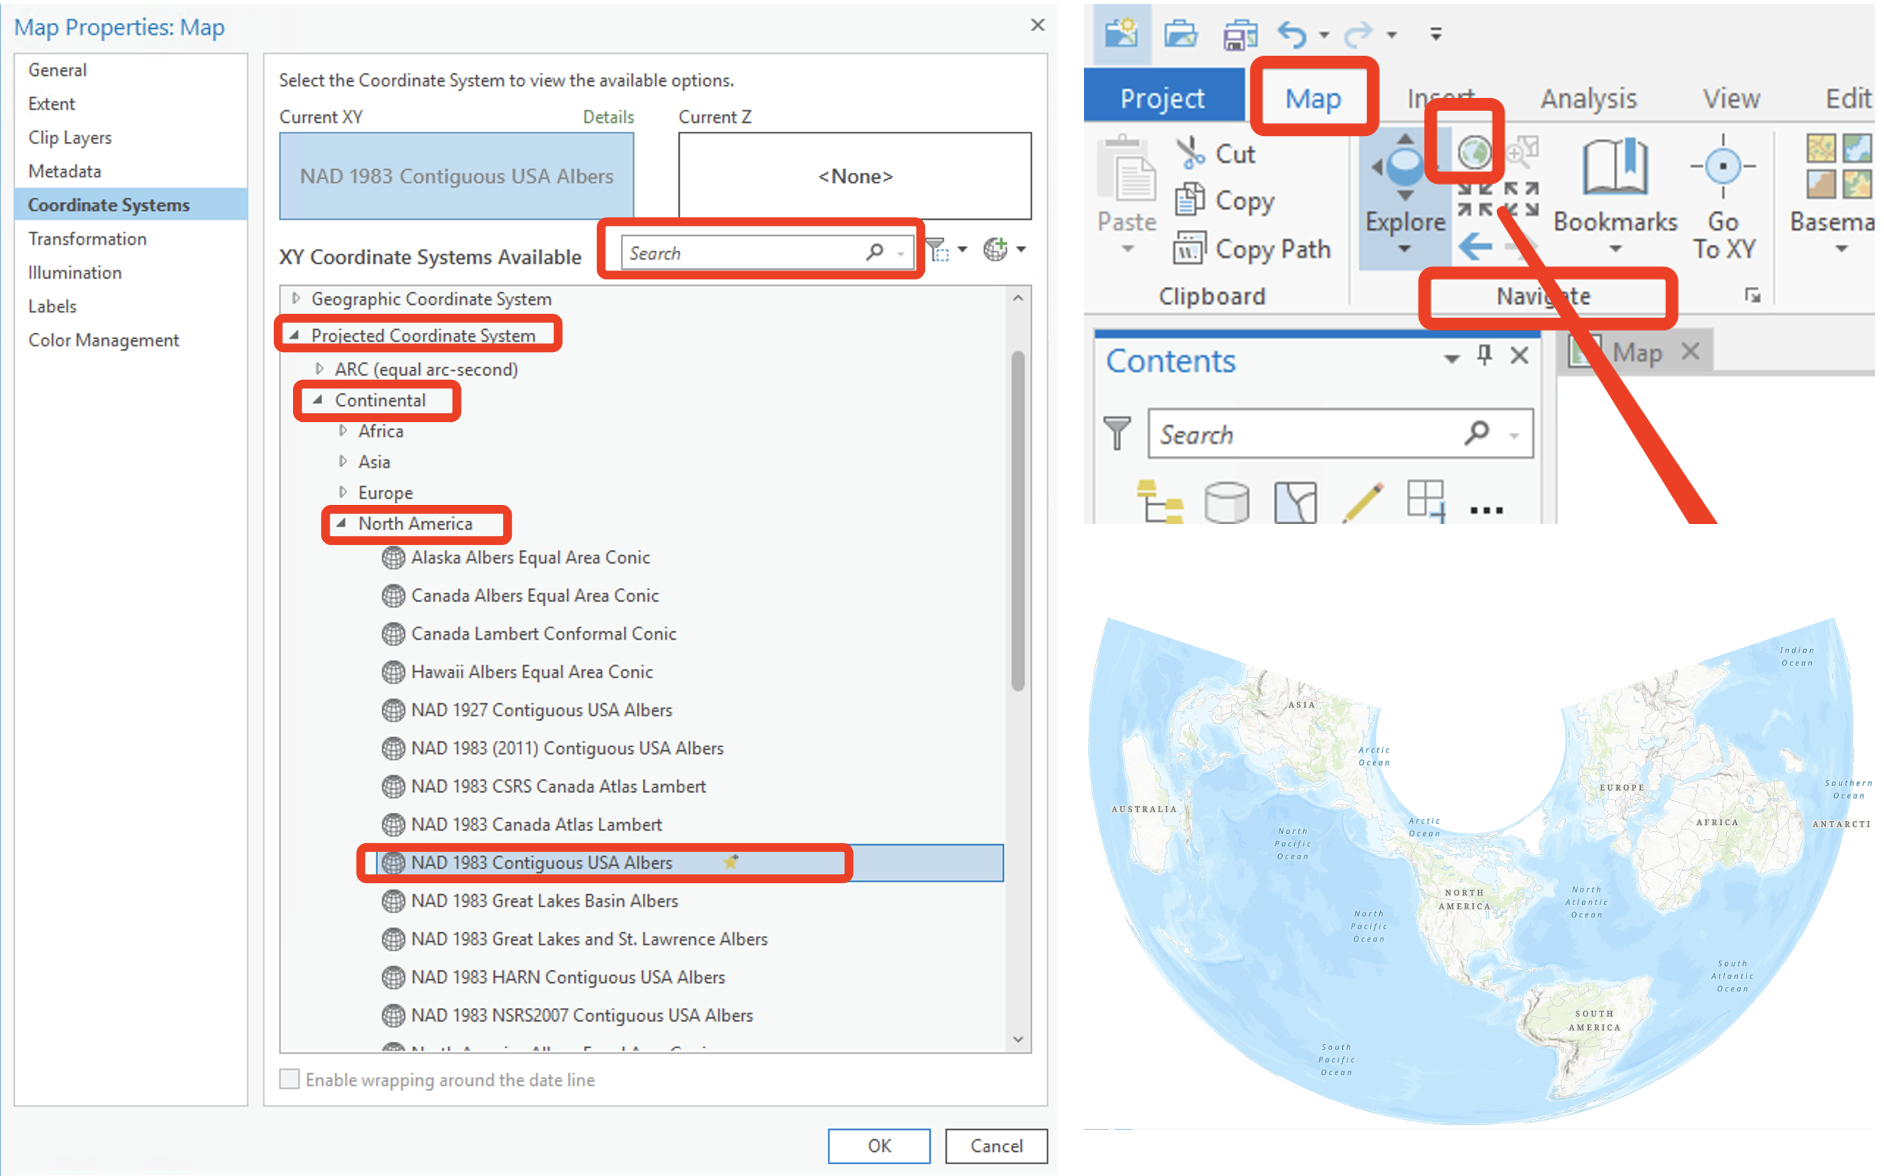
By zooming to full extent, you can see why this is an
appropriate projection and coordinate system for the North American
continent (Centered in North America), but not so much for the rest of
the world.
If we take a look at the Layer properties for the World
Topographic map, we will note that: the projection has NOT actually
changed (WGS 1984). We have projected this data “on the
fly” to match the parameters of the Map frame.
Therefore, projection on the fly is only a convenient
way of exploring data. It doesn’t apply any real change to the
projection information to your spatial data. For your spatial analysis,
you should never simply rely on projection on the
fly.
Set from a layer data
You can define a coordinate system for your Map Frame based on your added layer data.
You can also define a coordinate system for your Map Frame based on your layer data that is not added to your map frame.
Now let’s insert a new empty Map Frame in ArcGIS Pro and name it “Set Projection From a Layer”.
Go to Map Frame properties under
Coordinate Systems.
- click the
Add Coordinate Systembutton
- click
Import Coordinate Systembutton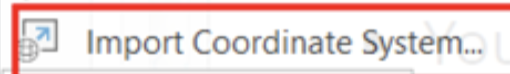
- Browse to a data source (could be a .shp file, or previously saved .prj file) that is defined with the coordinate system you want to use. In this case, let’s use TCPars2014 from the lab 3 data folder.
- You can also add this particular coordinate system to your Favorites list to make it available to all your projects.
Now notice how your base map changes to an football shape!! If we look at the Map Frame properties, we note that its coordinate system has match the one you just import. It is now Transverse Mercator projection, state plane coordinate system, North American Datum 1983.
Note, ArcGis Pro does not automatically change the units to feet (which is what suppose to be), instead, it retain the decimal degree. But allow users to toggle between various coordinate units. Let’s manually change it to US Feet in this case:
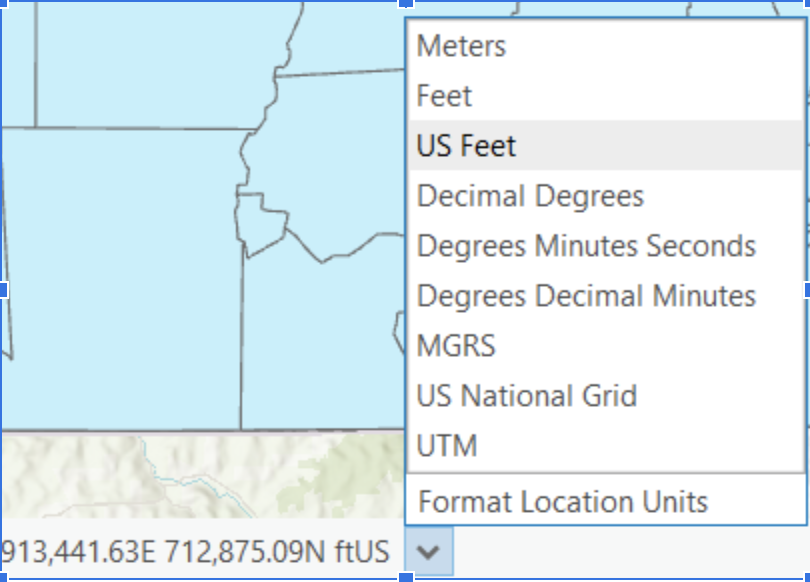
By moving the mouse around the screen, you can see changes in the State Plane coordinate position. The city of Ithaca lies approximately at (840000, 890000 ft), which is the position relative to the false origin.
In order to re-test “Projection on the fly” function, now let’s add “cty036” and the parcel layer TCPars2014 together. Note how the data sets (counties and parcels) line up very well.
Open the layer Properties for “cty036” and check its
Spatial reference under Source. The layer only
has a GCS, but no PCS.
Note again: As soon as you close this session of ArcMap, the “on the fly” projection will disappear it is temporary.
Now, let’s say you wanted to create a new shapefile of NY counties, but with State Plane coordinate (i.e. the coordinate system of the current data frame).
- You can right click on the counties layer and go to
Data/Export Features. - The
Export Featuresdialog box will open. Under theEnvironmentstab, you will be able to specify theOutput Coordinate Systemto match TCPars2014 (or Current Map, as they are the same). - Go back to the
Parameterstab, save the new layer as NYcounties_stateplane into your output folder.
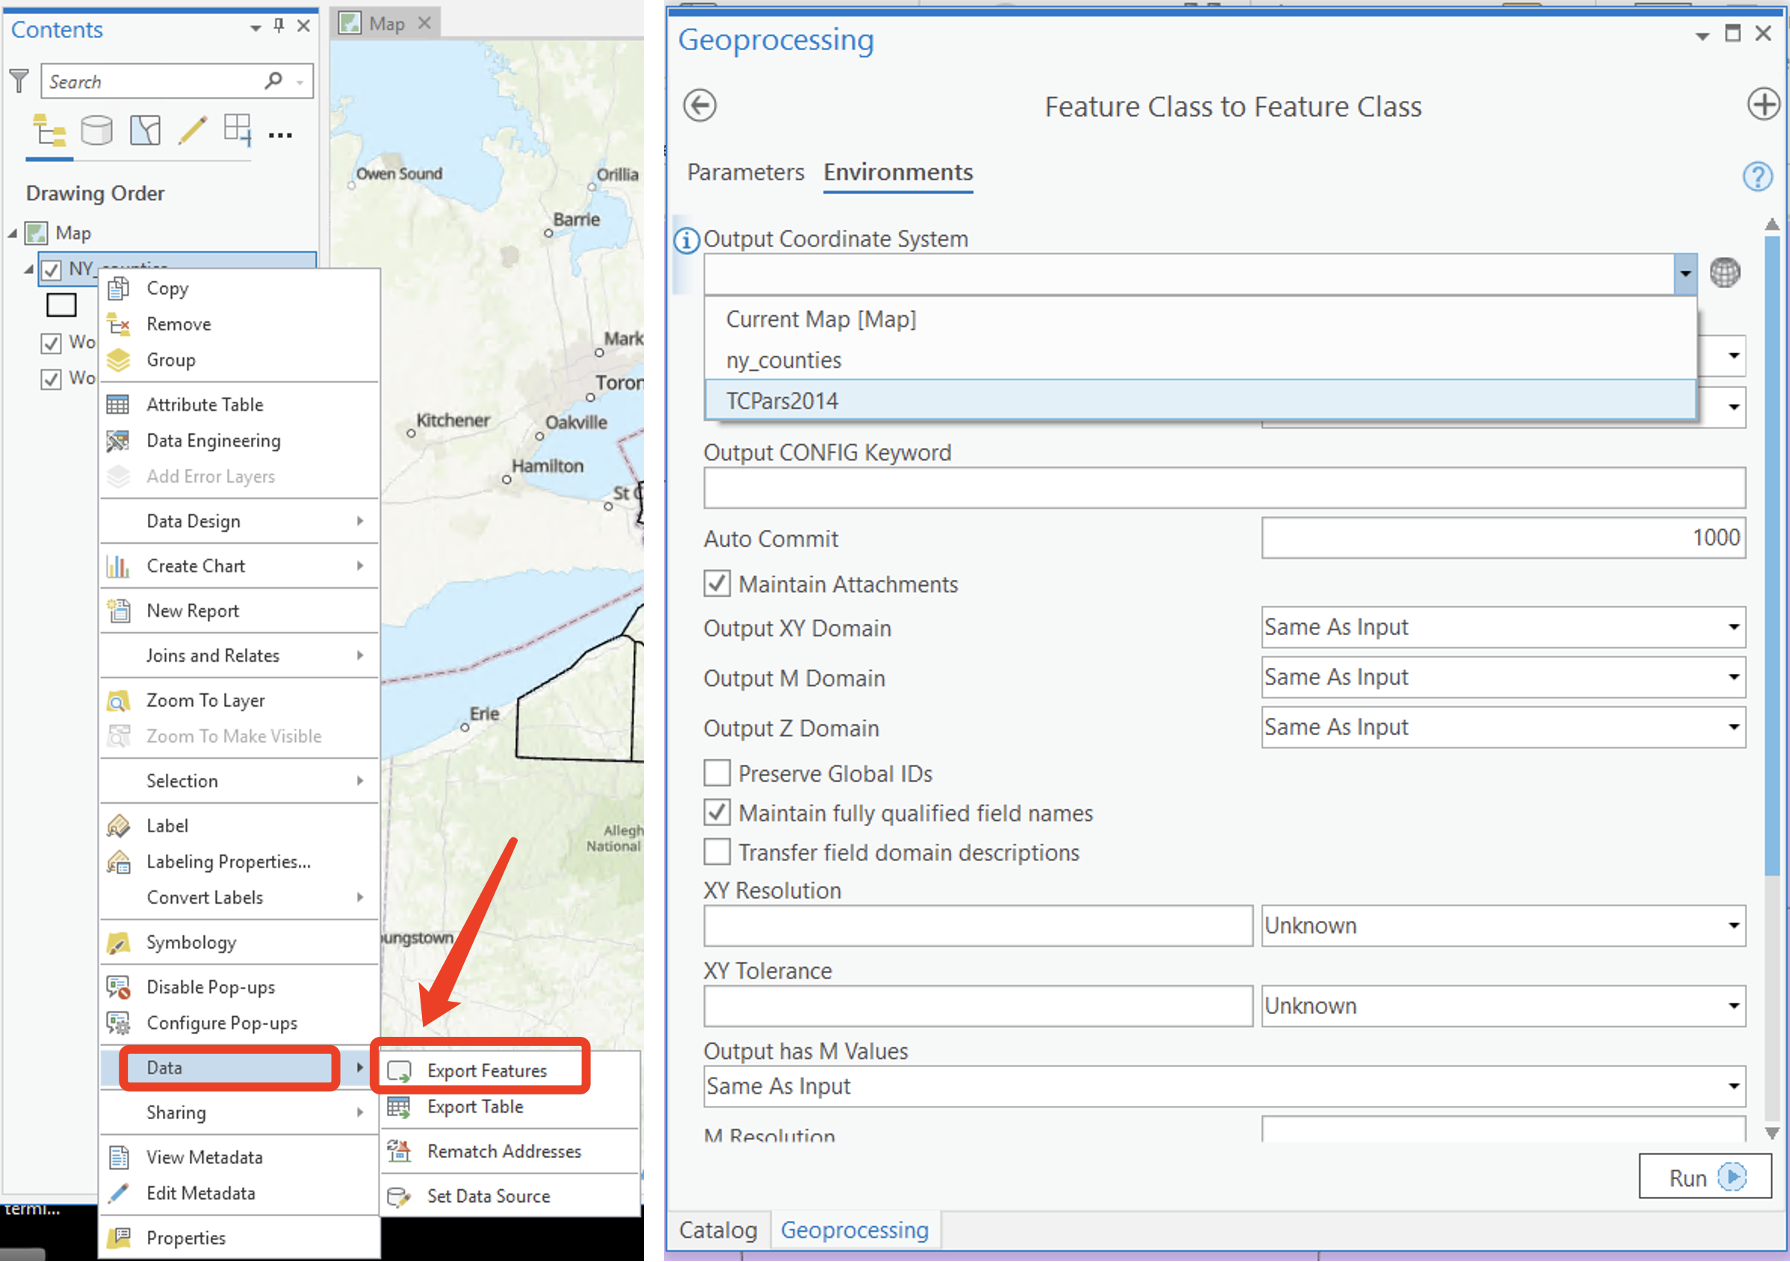
- With this step, you actually create and permanently save a new version of the NY counties layer, but using a different coordinates system (check its properties).
Define a Projection
Define a projection and Project sounds very similar but they are different. Check out this blog to learn more.
Remember when your data doesn’t have a coordinate system, or you suspect it has the wrong one, you want Define Projection. When your data already has a coordinate system but you wish to convert it into a different one, you want Project. (From Heather Smith)
Now let’s practice define a projection where your data doesn’t have a coordinate system or you suspect it has the wrong one. Now let’s insert a new empty Map Frame in ArcGIS Pro and name it “Define Projection”.
Lost/missing projection information
Check the landmarks data under your lab folder, notice that there is no .prj file.
Now add landmarks (this is a point dataset of Tompkins County landmarks).
What happened? I mean, where do they landing on the map?
You may have to zoom to full extent to figure out what happened (this function is very handy when you deal with data with missing or wrong projection because they usually land on the wrong spot!).
It is likely they end up not even locate on the map! ArcGIS added the data but was not able to project “on the fly” because it does not have a .prj file.
Right click on landmarks and open the layer properties. Under
Source/Spatial Reference you will note that the Coordinate
System is unknown.
Note that ny_census_tracts, and roads_cl also do not have .prj files attached, but “cty036” and TCPars2014 do.
Don’t worry, let’s define the projection (i.e., write a new .prj file) so that ArcGIS can readily interpret their projection.
Now also add ny_census_tracts, and roads_cl to the Map view.
Now we need to figure out what projection for each layer with missing projection information you want to define. When you work on a project, they might be stated in the project requirement (that’s straightforward). Or like this time, we might need to tweak around.
To find out what their projections are, we can find some clues based on the Extent of these layers.
Right click on the ny_census_tracts layer and go to
Properties. Under Source, go to
Extent. Examine the coordinates in the Extent box and note
that they fall between longitude -180 and +180 and latitude -90 and +90.
This implies Decimal degrees and therefore a Geographic Coordinate
System, not a PCS.
Now let’s examine the shapefile
Properties/ Source/ Extent for roads_cl. Take note of the
coordinates. Now, take a look at the extent for TCPars2014. Note that
the coordinates are similar, and since TCPars2014 has a defined
projection, you can conclude that roads_cl can be set as the same as
TCPars2014.
As a rule of thumb, if the data is in the United States and shows an extent in which the coordinates to the left of the decimal are six, seven, or eight digits, the data is probably either State Plane or Universal Transverse Mercator (UTM) coordinate systems, both of which are projected coordinate systems (PCS).
Now examine Layer Properties/Source for landmarks. Note that its coordinates under the Extent tab are very large and are different from roads_cl, suggesting they are not State Plane, but perhaps UTM? (When you become more experience, you can just guess, or you can Google for its appropriate and conventional coordinate system.)
Now imagine you already become a Master of ArcGIS Pro and you know what should be its coordinate system based on your rich experience.
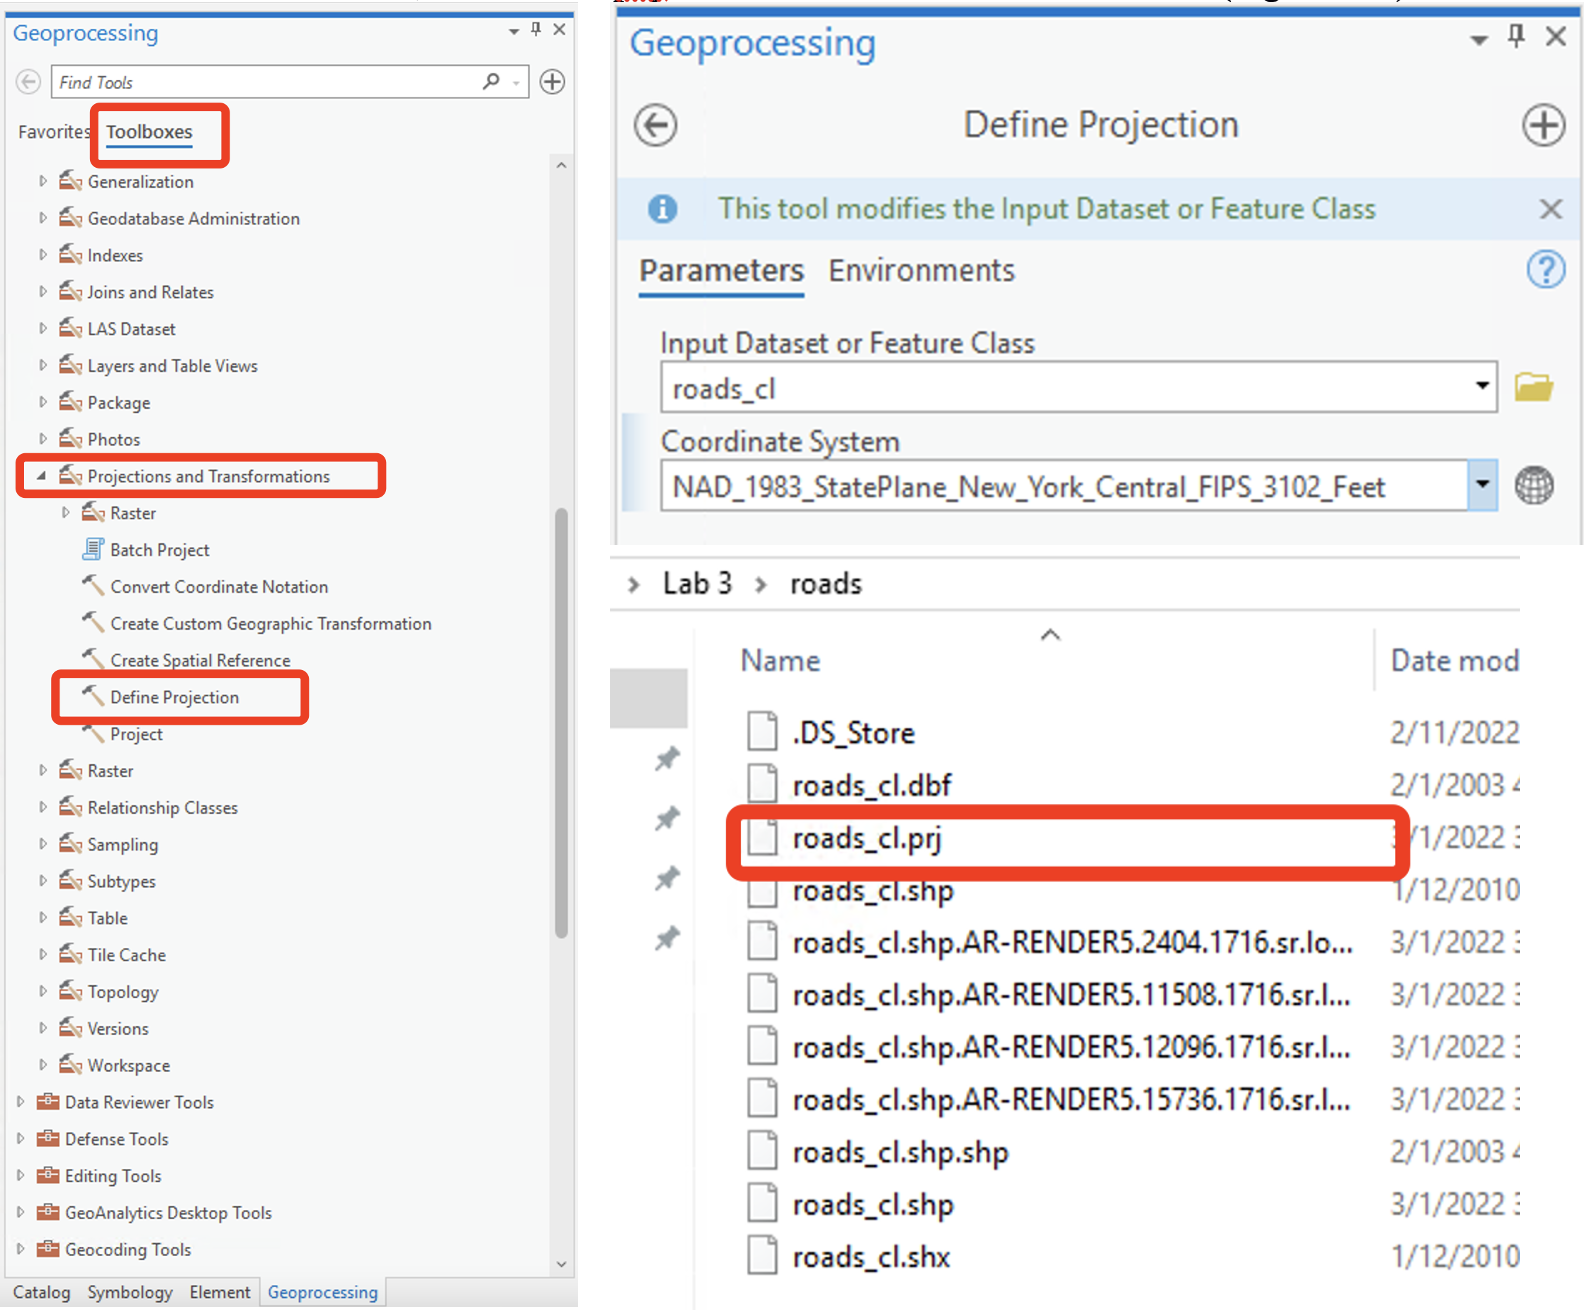
Under the Analysis Tab, go to Tools. Under
Toolboxes, navigate to
Data Management Tools/Projections and Transformation/Define Projection,
or just simply search for it.
In Define Projection' dialog box, underInput Dataset’ or
’Feature class`, select roads_cl from the dropdown menu.
Earlier, we noted that roads_cl had similar coordinate system as
TCPars2014 (NAD_1983_StatePlane_New_York_Central_FIPS_3102_Feet), so
from the Coordinate System drop down menu, we select that
(just the existing layer you have added to your map view). Click Run.
Back to your folder, note that a .prj file has been written for the road
layer.
Following the same steps outlined, define the projection for both ny_census_tracts.shp and landmarks.shp as follows:
- ny_census_tracts.shp: GCS_North_American_1983 under GCS
- landmarks.shp: NAD_1983(2011)_UTM_Zone_18N under PCS
Here are the detail steps of defining projection for ny_census_tracts.shp. You should be able to define the projection for landmarks.shp by yourself.
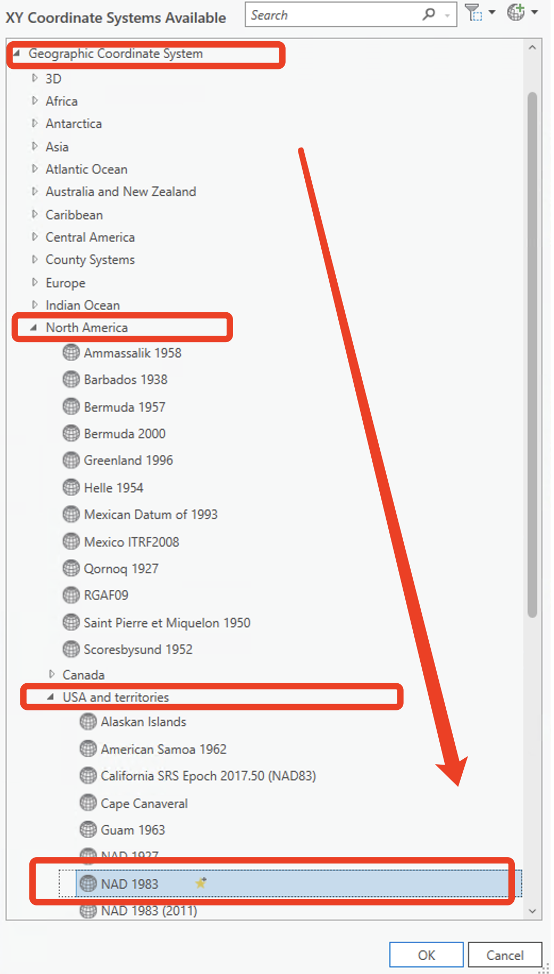
We identified ny_census_tracts.shp as having a Geographic Coordinate System.
- To select a coordinate system that is not represented by an existing
data layer, click the
Globe icon
- Navigate to Geographic Coordinate System — North America — USA and territories — NAD 1983.
Note that as you assign these projections, ArcGIS was able to read the .prj files and immediately project each layer on the fly. Bear in mind that you have not in any way altered or transformed the layer data since .prj is just a supporting file. However, you do make some changes to your original shapefiles.
Project Data
Although ArcGIS Pro can automatically projects the files “on the fly”, you may need to create data sets where the files are all projected in the same projections, particularly if you want to undertake geoprocessing functions and further spatial analysis, not just create map layouts. This need us to utilize the Project from the toolboxes. This process is quite simple if you know how to define projection.
But keep in mind, shaphfiles with lost/missing projection information cannot be projected. Now let’s insert a new empty Map Frame in ArcGIS Pro and name it “Project Data”.
Now project ny_census_tracts, landmarks, and roads_cl so that they all have the same projection as parcels layer: NAD 1983 StatePlane New York Central FIPS 3102 (Feet).
- Search for
Projecttool. - Click on the browse directory for
Input Dataset or Feature Class. - Navigate to the directory where you have placed the defined versions
(projection defined) of ny_census_tracts, roads_cl, and landmarks.
- Add landmarks (you should be able to access this through the
dropdown menu). This will automatically update the
Input Coordinate Systemto reflect the current projection (in this case UTM) and theOutput Dataset or Feature Classwill automatically be named landmarks_Project.shp. Your data will automatically be saved into your output folder since we set up the environement at the beginning. - For the
Output coordinate system, click on browse folder. Navigate to theProjected Coordinate Systemsdirectory until you find NAD 1983 StatePlane New York Central FIPS 3102 (Feet) - You should have identified the parcels and road layer which is already in State Plane. (In this case, your favorites)
- Click Run.
- Add landmarks (you should be able to access this through the
dropdown menu). This will automatically update the
- Now project ny_census_tracts shapefile from GCS NAD 1983 to NAD 1983 StatePlane New York Central FIPS 3102 (Feet) following the steps outlined above.
You do not need to project roads_cl shapefile because it is already defined as NAD 1983 State Plane New York Central FIPS 3102 (Feet) in the previous section. Add ny_census_tracts_Project, landmarks_Project and roads_cl to the Map layout. Identify and select a preferred Basemap. Note, you will have to make the census tracts layer hollow using the symbology tab in order to display your basemap.
Now it’s your turn!!!
There are total 6 Maps for this assignment. (120 points)
Note from now on, be sure to include projection information as part of the notes (inserted text) on each map layout! (We start to include more and more information in our note!!!)
And remember to start a new map session for different maps.
Map 1 (10 points)
First of all, complete the Map we just made including:
- A layout showing landmarks, roads and census tracts for Tompkins
County (including the parcels layer)
- Include a state level context map.
- North arrow, scale bars, legend, title, notes all required
Map 2 (10 points)
Open a new Map session and add WORLD30 and CNTRY92.shp. Note the projection. Change the data frame projection to “Mollweide” (Look in the ‘World’ folder).
- Short Answer: Is this a better choice for a world projection? Why or why not? (5 points)
- Map 2: Create a layout and save it into your home directory using ‘The World from Space’ projection. (5 points)
Map 3 (20 points)
Open a new Map session and add COUNTIES. Note its projection.
- Now select two appropriate projected coordinate systems for the continental United States.
- Create a map layout of the original projection and 2 additional projections you have chosen (Include all on the same layout). (10 points)
- Discuss some of the differences between these projections. (5 points)
- Why does the 49th parallel (Google it) appear flat when using geographic coordinates system, but curved when a projected coordinate system is used? (5 points)
Map 4 (15 points)
Open a new Map session and add “NY_counties”. Note its projection.
- Add STATES. Zoom out. What happened to the West Coast?
- Explain why what you see is kind of like the “New Yorker” view of the United States? (5 points)
- Create a layout and save it into your home directory. (10 points)
Map 5 (15 points)
Open a new Map session and add COUNTIES layer.
- Select out the counties for your home state or you like/wish to visit (using whatever method you wish).
- Create an appropriate map layout using whatever projection you think
is approiate (Recall the lecture).
- Create a map layout (10 points) and explain which projection you used. (5 points)
Map 6 (20 points)
Open a new Map session and let’s remake the map we made back in Lab_1. Create a map layout (10 points) that is stored in the same projection and coordinate system (your choice).
Import all the data layers (located in a folder called Tompkins), including Tompkins_buildings2014, Tompkins_munis2010, Tompkins_roads, Tompkins_pollingplaces2013.
Each of them is in a different projection/coordinate system combination. Some of them may have a projection defined, some may not.
In addition to a map layout (No need for context map this time), please include a write up (10 points) of the steps you took to complete this assignment, as well as screen shots of each shapefile’s layer properties to show that they all are in the same projection.
Map 7 (10 points)
Follow this tutorial on Fix data when it appears in the wrong place. Add the data from your homework folder named “Floodarea”. Make a map layout showing the flood plain with the corrected projection. Including all the necessary elements and a context map for your layout.
Map 8 (20 points)
Follow this tutorial on Choose the right projection, only go to the last part of it, which is Map the border of two UTM zones. You will learn how to create a custom projected coordinate system. Open the project from your homework folder named “Projection.ppkx”. Go to Border, make a map layout with your customized projected coordinate system with all the necessary elements. No need for context map.
The END