Lab 10: Scenario Planning and GeoPlanner
Xiaozhong Sun
2023-05-07
Due Date: April 19th
Instructor: Xiaozhong Sun (xs243@cornell.edu)
Lab TAs: Wenzheng Li (wl563) / Ishan Keskar (iuk3) / Aditi Parihar (ap973)
Location: Sibley 305, Barclay Gibbs Jones Computer Lab
Total Points: 100
Goals for this lab
In today’s lab, we are going to explore Geoplanner through a case study: Develop plans to create more affordable housing in San Francisco.
San Francisco property prices have skyrocketed and only 13 percent of homebuyers are able to purchase a home. One way the city intends to ease the housing shortage is through infill development, which develops empty or underused land parcels within existing neighborhoods.
Where can the city of San Francisco build new housing through infill development? To answer this question, you’ll use GeoPlanner, a web-based planning tool for regional and local scales. With GeoPlanner, you’ll create scenarios, or plans, based on geographic data layers to explore solutions to complex problems, like the question of housing. Before you start designing scenarios, you’ll create a new GeoPlanner project, customize the project’s settings, and add relevant data layers. You’ll also limit the data to a study area to reduce analysis time.
Instructions
Please follow this tutorial up till the section above Export results and then finish the tasks below. Remember, you need to apply what you have learned in this tutorial to finish the assignments.
Now it’s your turn!!!
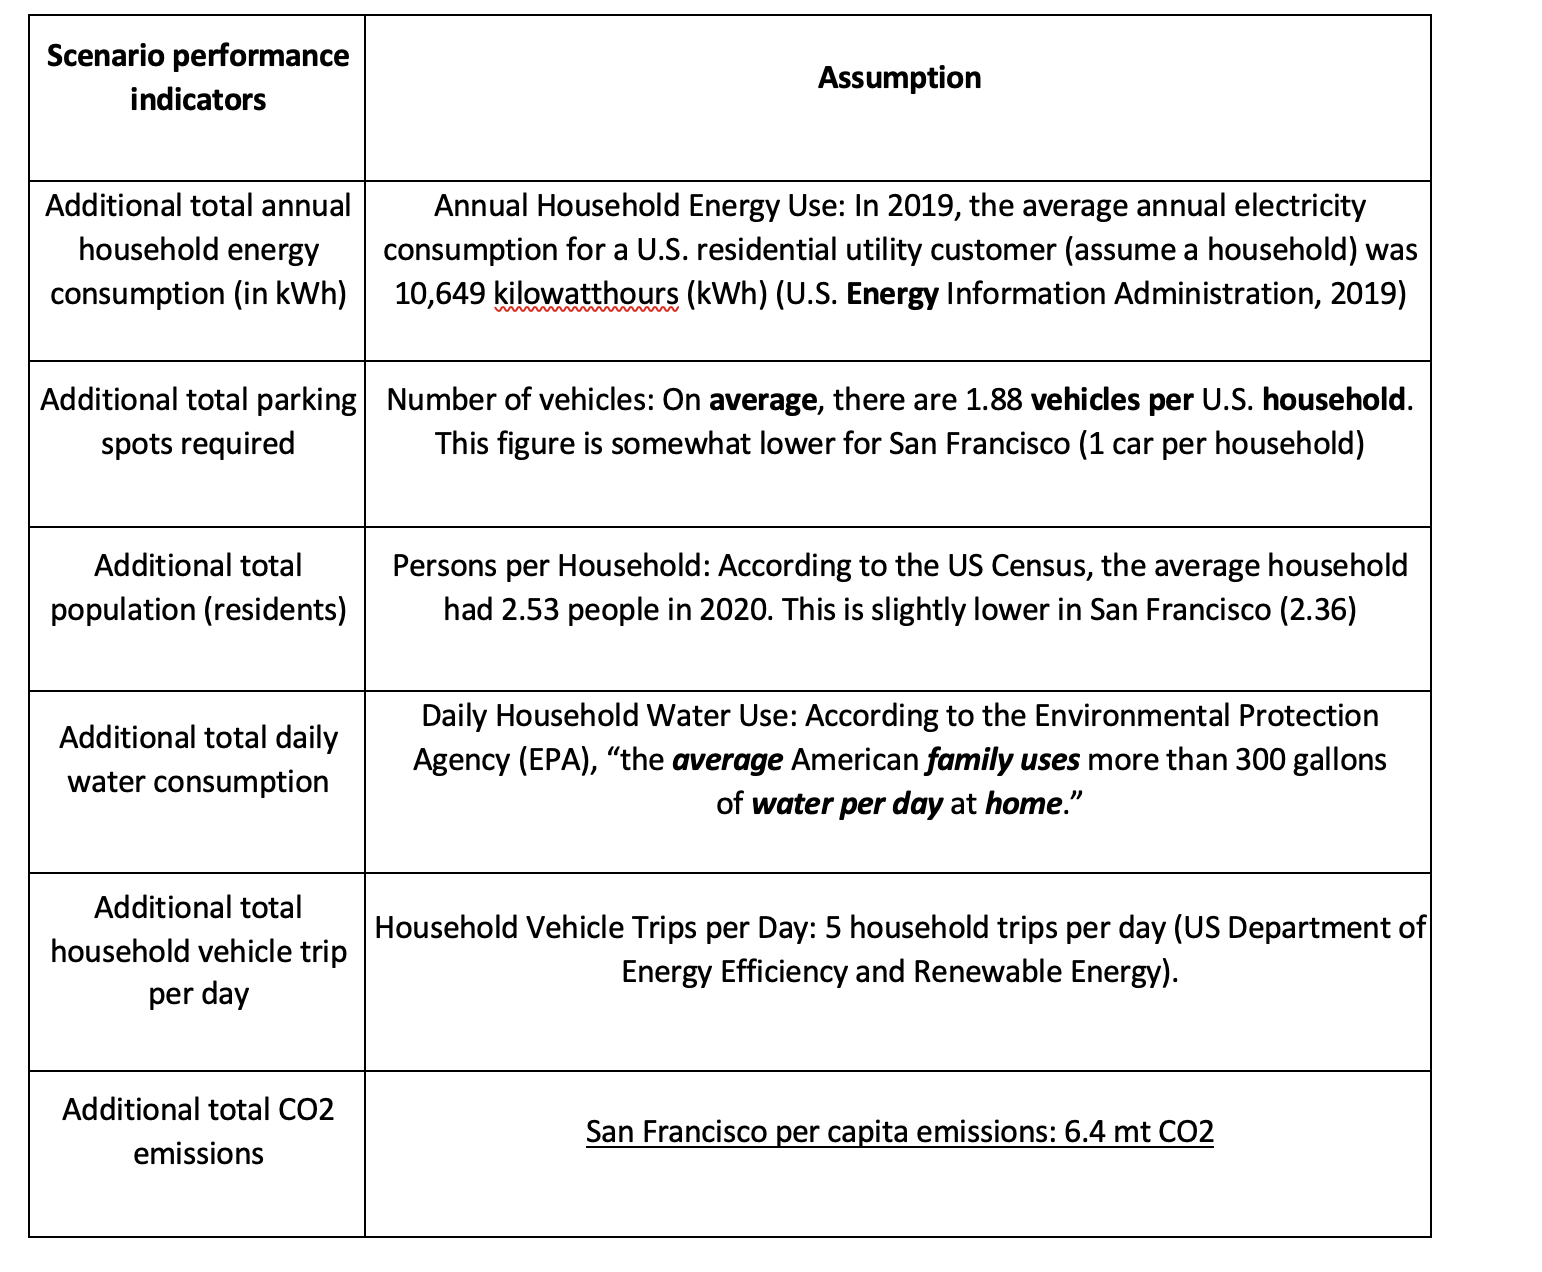
Calculate additional scenario indicators (referring to the instruction above) using the assumptions provided below in the table and based on the new assumption of the population per household (please note that this will entail creating composite indicators).
Under the
Evaluatetab, selectScenario comparison. Select the ‘proposed housing’ and the ‘proposed housing 5 mins from stations’ scenario and include the scenario comparison table and screen shots of maps in your write-up (30 points).
Create an additional scenario that prioritizes proximity to parks.
Identify vacant properties that are within 0.1 mile of parks and open spaces. This time use buffer analysis (use completely within option) instead of travel-time areas. Calculate the scenario performance indicators listed in question 1 for scenario “close to the parks”.(30 points)
Include the scenario comparison table and screenshots of maps in your write-up (30 points). Compare and contrast the 2 scenarios (5-mins from station and 0.1 miles from park and open space) in terms of their performance indicators? (10 points)
The END